Showing posts with label Physics. Show all posts

Friday, June 26, 2009

Constraining Modified Dispersion Relations with Gamma Ray Bursts

Giovanni Amelino-Camelia and Lee Smolin have a new paper on the arXiv:

    Prospects for constraining quantum gravity dispersion with near term observations
    arXiv:0906.3731v3 [astro-ph.HE]
    By Giovanni Amelino-Camelia, Lee Smolin

    We discuss the prospects for bounding and perhaps even measuring quantum gravity effects on the dispersion of light using the highest energy photons produced in gamma ray bursts measured by the Fermi telescope. These prospects are brigher than might have been expected as in the first 10 months of operation Fermi has reported so far eight events with photons over 100 MeV seen by its Large Area Telescope (LAT). We review features of these events which may bear on Planck scale phenomenology and we discuss the possible implications for the alternative scenarios for in-vacua dispersion coming from breaking or deforming of Poincare invariance. Among these are semi-conservative bounds, which rely on some relatively weak assumptions about the sources, on subluminal and superluminal in-vacuo dispersion. We also propose that it may be possible to look for the arrival of still higher energy photons and neutrinos from GRB's with energies in the range 1014 - 1017 eV. In some cases the quantum gravity dispersion effect would predict these arrivals to be delayed or advanced by days to months from the GRB, giving a clean separation of astrophysical source and spacetime propagation effects.
In their paper, Giovanni and Lee summarize the status of extracting information about quantum gravitational effects from gamma ray bursts. The idea is that quantum gravity could affect the propagation of photons; we previously discussed this possibility here and here. Such modifications are quite generic and appear in various approaches to describe quantum graviational effects, some of which are inspired by loop quantum gravity, some are inspired by string theory, some are inspired by God-knows-what. There are however no derivations of such effects from a fundamental theory, at least not yet. At the present status, one should thus understand these models as examinations of specific features the to-be-found underlying theory could have.

While the discussed effects on the propagation of photons are extremely tiny and way too feeble to be observable in experiments on Earth, they could add up when the travel is very long distance. In the models the authors consider, the strength of the effect depends on the energy of the photon. The speed of light is then no longer a constant but a function of the energy of the photon. In the low energy limit, photons travel with what we usually call THE speed of light, c [1].

To first approximation there are two cases: either the high energetic photons are faster than the low energetic ones, or the high energetic photons are slower than the low energetic ones. I would have guessed the majority of people had thought if such a scenario is true then the photons with higher energy should be faster. If only because we are secretly all dreaming of traveling faster than the speed of light. But that's not what the data seems to suggest to me.

These scenarios can be tested with signals from gamma ray bursts, highly energetic flashes of light originating in faraway Galaxies. Their spectrum covers a large range of energies. If one records photons of different energies with an exact timing, one can compare their arrival time. In my previous post we had been discussing the gamma ray burst GRB 080916C (the number encodes the date). In this burst, the high energy photons seem to be arriving with a delay relative to the lower energetic ones. However, the statistics of that one burst isn't very convincing. Yes, there was that one lazy high energy photon with 13 GeV that arrived 16.3 seconds after the onset of the burst. And okay, there were a couple more photons that seemed to be delayed, but then the low energy signal had two peaks rather than one. This might have indicated it was a fairly uncommon burst.

However, Giovanni and Lee sifted through some databases and found a couple more gamma ray bursts that were recorded during the last year that show similar characteristics, if not so pronounced. In all cases, the high energetic photons were delayed. Their paper offers a neat table summarizing these events, but unfortunately no statistical analysis for how significant the patterns are.

In the following sections of the paper they constrain several models with that data, most notably those who break and those who only deform Lorentz Invariance. In the first case, the universe has a preferred frame relative to which the energy of the photons is defined. In the second case there is no such preferred frame [2]. They further distinguish between the case where high energetic photons are faster (superluminal) and those in which they are slower (subluminal), and extract bounds on the quantum gravity scale for both cases. It is somewhat unintuitive to extract bounds also on the superluminal case when there is a trend in the data for higher energetic photons to arrive later, but it could be an astrophysical effect that is hiding superluminal propagation. The bounds on the superluminal case however are weaker.

There is quite a lot of astrophysics involved in the emission of these photons and the most conservative explanation for the delay is certainly that the photons were emitted with delay. While Giovianni and Lee's analysis offers useful first estimates, what would be needed is a procedure that allows to cleanly separate astrophysical source effects from effects during propagation. To do so, one had to extract the dependence of the signal on the distance to the source.

In the final section of the paper, Giovanni and Lee suggest to obtain further experimental data by looking for photons of even higher energies (that could be delayed up to months) or neutrinos that are emitted from the same source. In both cases, I wonder whether it is feasible to obtain any sensible statistic within the lifetime of the average physicist.

Altogether it is a very useful paper that summarizes the status. It leaves one wanting though for a more thorough data analysis.


[1] Not to be confused with theories with a varying speed of light which usually means a variation with time, not with energy.
[2] I wrote a paper showing the second case doesn't make sense if you have an energy dependent speed of ligh. You can wind yourself out of my proof by making your theory even weirder.

Sunday, June 14, 2009

Shrinking Betelgeuse

This is news I can't let uncommented, after all my recent posts about interferometry: In a recent Astrophysical Journal Letter, a team of astronomers lead by Charles H. Townes, Nobel laureate for his contribution to the development of the laser, report "A Systematic Change with Time in the Size of Betelgeuse".

Betelgeuse, or α Orionis, is the bright red star in the shoulder of the constellation Orion. In 1921, Albert Michelson and Francis Pease succeeded in measuring its diameter as about 50 milliarcseconds (mas), using an interferometer mounted onto the main telescope of Mount Wilson observatory. This was the first time the diameter of a star could be measured. 50 milliarcseconds is a tiny angle, corresponding roughly to the apparent size of an object 100 metres big on the Moon. But given the distance to Betelgeuse, this means the star, when put in the place of the Sun, would fill the solar system up to the orbit of Jupiter.

In the meantime, Betelgeuse could be resolved directly using the Hubble space telescope, and its distance measured to be 200 parsecs (650 light years), though there remains an uncertainty of about 25 percent. And it has been the object of many interferometric studies.

But given the diffuseness of the outer limits of this Red Supergiant star, which on average has a density less than 1/10000 the density of air, measurements of its diameter depend on the wavelength of observation, as the thin outer atmosphere has different transparency for different wavelengths. Here is a comparison of the shape of Betelgeuse, as reconstructed from interferometric measurements taken within two weeks at three different wavelengths in the infrared:

Source: Surface imaging of Betelgeuse with the Cambridge Optical Aperture Synthesis Telescope (COAST) and the William Herschel Telescope (WHT).

The two images on the right were reconstructed using data from the Cambridge Optical Aperture Synthesis Telescope (COAST), and the image on the left with data from the William Herschel Telescope (WHT). Each image has a side length corresponding to 100 mas, and one sees big differences in the diameter of the star, and of its surface features, depending of the wavelength at which it is observed.

This fact makes it difficult to compare directly angular diameters of Betelgeuse obtained with different instruments at different wavelengths. Now, the letter of Charles Townes' team reports on data collected with one instrument at one wavelength over the last 15 years. Using the Infrared Spatial Interferometer (ISI) on Mount Wilson, not far from where Michelson and Pease did their pioneering work, they observe at a wavelength of around 11000 nanometres, and write:

The diameters measured by the ISI are not particularly inconsistent with previous measurements, are rather accurate, and show clearly that the star has systematically decreased in size by about 15% over the past 15 years.

(Click for larger view – data from Townes et al., APJ Lett 697 (2009) L127-L128)

The graph shows their data (note that the zero-line is suppressed, so the change appears bigger than it actually is), together with a best fit by a parabola in grey, and the Michelson & Pease result in orange. Michelson and Pease estimated that the actual diametre of Betelgeuse could be larger by 10%-15% because of systematic errors in their measurement method. I have added the line in magenta, which shows, for comparison, the radius of the orbit of Jupiter, using the latest Hipparcos/VLA parallax distance to Betelgeuse to convert angles in actual distances.

Betelgeuse has been known to be a star with variability, but it seems that this change in size is odd and unexpected, even more so as its luminosity has been roughly constant. It's fascinating to me that such a change can be measured. As the APJ Letter concludes:

ISI measurements over the last 15 years clearly show a systematic change in the diameter of α Ori. This change may or may not be periodic; if it is, the period is likely rather long, perhaps a few decades. [...] It should be valuable to continue accurate measurements of α Ori's size and other characteristics in order to understand the dynamics involved in this striking change, and to have systematic long-term measurements of similar stars.


Sunday, June 7, 2009

Hello from the SUSY 2009

As previously mentioned, I am here in Boston at the SUSY 2009, the 17th International Conference on Supersymmetry and the Unification of Fundamental Interactions. Since its inception 1993, the SUSY has become the meeting for everything around and everybody involved in physics beyond the Standard Model, from Supersymmetry and its breaking, via extra dimensions of any sort (large, universal, warped), String model building in general to Grand Unification and the phenomenology of Quantum Gravity (though mostly focussed on graviton and black hole production at the LHC). What was previously called the session on "alternatives" is now called "unconventional approaches." The word "alternative," it seems, is a bit worn out. The SUSY is a lively mix of experiment with theory, which is one of the reasons why I like it.

The meeting this year takes place at Northeastern University, where I had not been before. It is a nice place, very conveniently located, with a small but well maintained campus. (I took some photos, but unfortunately forgot the cable I need to upload them, so they will follow later). I had not known that Northeastern University was also where the first SUSY conference in 1993 was held. 

On Friday we had the first session of plenary talks with updates from the LHC and TeVatron, and a reception in the evening to get to say hello to familiar and unfamiliar faces. Every time I'm at the SUSY there seem to be more people. Maybe it's me getting old, but there are really a lot of young postdocs around this year many of whom are enthusiastic about their research and I'm sure they will make interesting contributions during their career. Most of them were crammed in the parallel sessions during the weekend. I too delivered my talk this afternoon (slides here), squeezed between SUSY breaking and degenerate vacua. I think it went reasonably well.

This evening, we also had a public lecture by Frank Wilczek from MIT (Nobel Prize 2004 together with David Gross and  David Politzer). Titled "Anticipating a New Golden Age," Wilczek explained what the LHC (The World's Largest Microscope) is and what it does, including the LHC Rap. He then went on to explain what Supersymmetry is and how it helps with the unification of the gauge couplings, expressing his conviction that Nature is giving us a clear sign that Supersymmetry is part of her workings (that part of the talk being identical to what he told at SciFoo last summer). He finished with the inspirational note that it's not only an exciting time to be a physicist, but an exiting time to be a thinking being - even if you are not actively working on these theories, we might be very close to unraveling some fundamental truth about reality. It was a very nice talk and I think the audience enjoyed it.

Thursday, June 4, 2009

This and That

Combining waves can make for quite spectacular effects. The June edition of Physics Today has two interesting articles available for free describing such situations:

  • In Probing stars with optical and near-IR interferometry, Theo ten Brummelaar, Michelle Creech-Eakman, and John Monnier explain how "new high-resolution data and images, derived from the light gathered by separated telescopes, are revealing that stars are not always as they seem." Now, the combination of radio telescopes to synthesize huge telescope apertures and gain the corresponding angular resolution is a well-established technique.
    But adding interferometrically the wave crests of visible light from a star collected in two separate telescopes is a more recent development. Performing some Fourier transforms results in images with an angular resolution of milli arcseconds - enough to see a human on the moon, or to resolve the size and shape of stars.


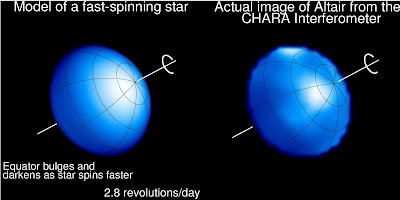
    Altair in the constellation Aquila, about twice as big as the Sun and 18 light years away, is rotating rapidly so that it is flattened. The image on the right has been created using interferometry with light waves. Credit: Ming Zhao (University of Michigan), from Imaging the Surface of Altair, John D. Monnier et al, arXiv:0706.0867v2.


  • Ocean waves are generated by fluctuating wind pressure on the water surface. Due to the dispersion of the phase velocity (longer waves run faster) and a weak interaction between different waves transferring energy to longer waves, dominant waves are the bigger the stronger and longer the wind blows. Together with the effect of opposing ocean currents, very big waves can emerge. In Rogue waves, Chris Garrett and Johannes Gemmrich look at the "rich and challenging physics [...] behind the gigantic ocean waves that seem to appear without warning to damage ships or sweep people off rocky shores."


    Rogue wave in the Bay of Biscay, France. Credit: NOAA Photo Library, via Wikipedia.


Sunday, May 24, 2009

Experimental Interferometry, Continued

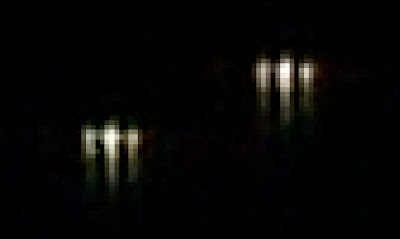
Last week, I did a little experiment in interferometry: I did mask the objective lens of my digital camera with a double-slit aperture, and photographed a scene with street lights at different distances. Far away lights showed a very nice interference pattern, as seen in this detail of the photo:


In the comments thread of the post, a question came up I hadn't thought about before: How comes that an interference pattern can be seen in the first place, given that the source of light looks white? After all, the broad spectrum of wavelengths from a white light should result in the superposition of the interference patterns for each wavelength, and a thus in a blurring of the fringes.

One reason for the appearance of the interference pattern is the spectrum of the street lights I had photographed: It is not a broad and continuous spectrum, but has a few bright lines. On the other hand, as I could convince myself, even for a broader spectrum, there is enough contrast between the main central spot and the satellite spots of the pattern to be clearly distinguishable.

When searching for information about the spectral features of typical street lights, I came across a great website, The CD-ROM Spectroscope, by astronomer Joachim Köppen. It explains, for example, how to see the spectra of street lamps using simply a CD-ROM. Actually, following the instructions on this site, I could check that the street lights are some variant of mercury vapour lamps - their spectrum looks pretty much like this photo taken from Joachim Köppen's site, with bright lines in the green, orange, and red:


Spectrum of a mercury vapour lamp as seen using a CD ROM as a diffraction grating; taken from: How to see the spectra of street lamps

I then set to figure out the diffraction pattern to be expected from the double-slit aperture in my experiment for light with different wavelengths. Actually, there is an analytical formula for the diffraction pattern of a double slit in the so-called far-field or Fraunhofer limit, i.e. for asymptotically large distances from the aperture. When a lens is used to map the interference pattern in the focal plane, as in my experiment with the camera, this limit is automatically reached. The interference pattern then only depends on the angle away from the optical axis. For two slits of width w a distance d apart, the intensity pattern for light with wavelength &lambda is described by the formula

where α is the angle away from the optical axis. The first fraction is the profile of the diffraction pattern for one slit, and the second fraction is the two-beam interference.

Actually, instead of using this formula, I found it quite instructive to play around with a small program to calculate the intensity pattern, by summing up the intensities of spherical waves emerging from the two slits, according to Huygens' principle. Thus, I calculated the intensity pattern for two slits w = 0.5 mm wide each with a separation of d = 1 mm, as seen on a screen in a distance of D = 10 m, and for different wavelengths. The result, which is pretty much the same as that from the analytical formula, is shown here:

(Click for larger view or the eps file)

The grey curve gives the sum of the intensities for the four different wavelengths. One sees that the pattern gets tighter for shorter wavelengths, and that, as a result, the satellite peaks are broadened. However, there is still enough contrast between the central maximum and the first pair of satellite peaks for the fringe pattern to be visible. All further peaks, on the other hand, will be washed out.

Now, to obtain the diffraction pattern of the street lights, one would have to sum up the diffraction patterns for different wavelengths, weighted with the spectral density of the mercury vapour lamp. There is enough contrast for the three fringes of the interference pattern to be distinguishable, and even for the solar spectrum, one could expect sufficient contrast to see interference.

One final question, however, remains: According to the plot of the diffraction pattern for different wavelengths, one could expect that the satellite peaks look coloured: more blueish on the side towards the inward peak, and more reddish on the outside. However, in the photo, above, there are no colours. How comes?

My guess is that this is due to the pixel resolution of my camera. Actually, what is recorded on the chip of the camera is the convolution of the diffraction pattern with the pixel characteristics of the CCD chip. One pixel of the photo corresponds to an angle of about 1/2 arc minute, and the peaks are about two arc minutes wide, corresponding to four pixels. This binning is too coarse to clearly distinguish colours, and hence, also the satellite peaks do look white.