In the comments thread of the post, a question came up I hadn't thought about before: How comes that an interference pattern can be seen in the first place, given that the source of light looks white? After all, the broad spectrum of wavelengths from a white light should result in the superposition of the interference patterns for each wavelength, and a thus in a blurring of the fringes.
One reason for the appearance of the interference pattern is the spectrum of the street lights I had photographed: It is not a broad and continuous spectrum, but has a few bright lines. On the other hand, as I could convince myself, even for a broader spectrum, there is enough contrast between the main central spot and the satellite spots of the pattern to be clearly distinguishable.
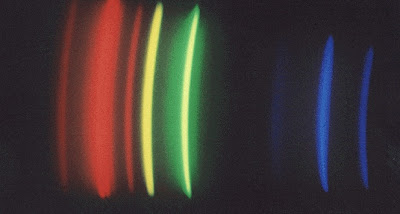
When searching for information about the spectral features of typical street lights, I came across a great website, The CD-ROM Spectroscope, by astronomer Joachim Köppen. It explains, for example, how to see the spectra of street lamps using simply a CD-ROM. Actually, following the instructions on this site, I could check that the street lights are some variant of mercury vapour lamps - their spectrum looks pretty much like this photo taken from Joachim Köppen's site, with bright lines in the green, orange, and red:

Spectrum of a mercury vapour lamp as seen using a CD ROM as a diffraction grating; taken from: How to see the spectra of street lamps
I then set to figure out the diffraction pattern to be expected from the double-slit aperture in my experiment for light with different wavelengths. Actually, there is an analytical formula for the diffraction pattern of a double slit in the so-called far-field or Fraunhofer limit, i.e. for asymptotically large distances from the aperture. When a lens is used to map the interference pattern in the focal plane, as in my experiment with the camera, this limit is automatically reached. The interference pattern then only depends on the angle away from the optical axis. For two slits of width w a distance d apart, the intensity pattern for light with wavelength &lambda is described by the formula

where α is the angle away from the optical axis. The first fraction is the profile of the diffraction pattern for one slit, and the second fraction is the two-beam interference.
Actually, instead of using this formula, I found it quite instructive to play around with a small program to calculate the intensity pattern, by summing up the intensities of spherical waves emerging from the two slits, according to Huygens' principle. Thus, I calculated the intensity pattern for two slits w = 0.5 mm wide each with a separation of d = 1 mm, as seen on a screen in a distance of D = 10 m, and for different wavelengths. The result, which is pretty much the same as that from the analytical formula, is shown here:
 (Click for larger view or the eps file)
The grey curve gives the sum of the intensities for the four different wavelengths. One sees that the pattern gets tighter for shorter wavelengths, and that, as a result, the satellite peaks are broadened. However, there is still enough contrast between the central maximum and the first pair of satellite peaks for the fringe pattern to be visible. All further peaks, on the other hand, will be washed out.
Now, to obtain the diffraction pattern of the street lights, one would have to sum up the diffraction patterns for different wavelengths, weighted with the spectral density of the mercury vapour lamp. There is enough contrast for the three fringes of the interference pattern to be distinguishable, and even for the solar spectrum, one could expect sufficient contrast to see interference.
One final question, however, remains: According to the plot of the diffraction pattern for different wavelengths, one could expect that the satellite peaks look coloured: more blueish on the side towards the inward peak, and more reddish on the outside. However, in the photo, above, there are no colours. How comes?
My guess is that this is due to the pixel resolution of my camera. Actually, what is recorded on the chip of the camera is the convolution of the diffraction pattern with the pixel characteristics of the CCD chip. One pixel of the photo corresponds to an angle of about 1/2 arc minute, and the peaks are about two arc minutes wide, corresponding to four pixels. This binning is too coarse to clearly distinguish colours, and hence, also the satellite peaks do look white.

No comments:
Post a Comment